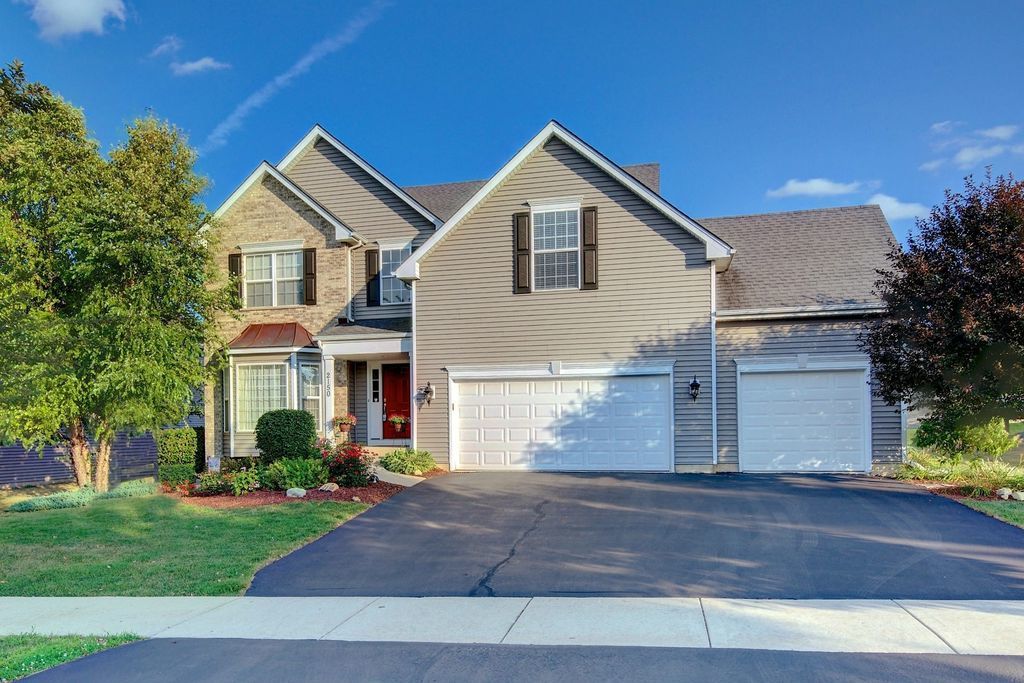
This four-bedroom home, 2150 Roaring Creek Dr, has a property tax bill of $12,364. | zillow.com
This four-bedroom home, 2150 Roaring Creek Dr, has a property tax bill of $12,364. | zillow.com
Property owners in Aurora paid nearly four percent of the value of their homes in taxes last year. That’s more than three times the national average, according to an LGIS analysis of real estate sales data in Kendall County from Jan 1. to June 30.
Local Government Information Service (LGIS) publishes the Kendall County Times.
Aurora, population 201,110, recorded a median sale price of $209,250, based on data from the 46 properties sold during the first half of 2018. In 2017, homeowners paid a median property tax bill of $8,184, according to county tax data from the Kendall County Assessment Office.
That’s 3.91 percent of the community’s median home value. In the U.S., the average effective property tax rate is 1.19 percent.
Put another way: a $209,250 home in Indiana, where the effective rate is 0.89 percent, would have a property tax bill of about $1,862, or more than $6,000 less per year.
The analysis, including 12 Kendall County communities with more than five sales since January, shows homeowners in Aurora, Minooka, Plano, Plainfield pay the highest property taxes in the county, each clocking in with effective rates higher than 3 percent.
Yorkville, Oswego, Montgomery, Bristol and Newark all have rates higher than 2.75 percent.
Illinois homeowners pay the second-highest property taxes in the country with an effective median rate of 2.32 percent, just behind those in New Jersey's (2.28 percent).
--
Kendall County communities paying the highest effective property tax rates
The following table ranks Kendall County communities by their median effective property tax rate, calculated using sales and property tax data from 2018.
| City | Jan - June 2018 Sales | Jan - June 2018 Median Price | 2017 Median tax | Effective Tax Rate |
| Aurora | 46 | $209,250 | $8,184 | 3.91% |
| Minooka | 18 | $186,500 | $6,129 | 3.29% |
| Plano | 95 | $150,500 | $4,817 | 3.20% |
| Plainfield | 22 | $357,500 | $11,056 | 3.09% |
| Yorkville | 190 | $230,000 | $6,818 | 2.96% |
| Oswego | 360 | $240,000 | $7,074 | 2.95% |
| Montgomery | 125 | $228,000 | $6,711 | 2.94% |
| Bristol | 6 | $183,750 | $5,404 | 2.94% |
| Newark | 10 | $185,000 | $5,305 | 2.87% |
| Joliet | 85 | $240,000 | $6,043 | 2.52% |
| Boulder Hill | 70 | $174,000 | $4,300 | 2.47% |
| Millbrook | 6 | $311,500 | $5,910 | 1.90% |
--
Kendall County median home price
The following table ranks Kendall County communities by their median sale price, which is calculated using prices of properties sold during the first six months of 2018.
| City | Jan - June
2017 Sales | Jan - June 2017 Median Price | Jan - June 2018 Sales | Jan - June 2018 Median Price | Change |
| Lisbon | 1 | $100,000 | 3 | $170,000 | 70.00% |
| Millbrook | 3 | $205,000 | 6 | $311,500 | 51.95% |
| Boulder Hill | 91 | $155,000 | 70 | $174,000 | 12.26% |
| Joliet | 133 | $216,500 | 85 | $240,000 | 10.85% |
| Oswego | 408 | $230,000 | 360 | $240,000 | 4.35% |
| Yorkville | 296 | $220,750 | 190 | $230,000 | 4.19% |
| Sandwich | 2 | $215,000 | 2 | $221,500 | 3.02% |
| Montgomery | 132 | $223,000 | 125 | $228,000 | 2.24% |
| Newark | 16 | $183,750 | 10 | $185,000 | 0.68% |
| Plano | 129 | $150,000 | 95 | $150,500 | 0.33% |
| Bristol | 7 | $185,000 | 6 | $183,750 | -0.68% |
| Minooka | 22 | $191,250 | 18 | $186,500 | -2.48% |
| Aurora | 70 | $215,500 | 46 | $209,250 | -2.90% |
| Plainfield | 36 | $405,000 | 22 | $357,500 | -11.73% |


 Alerts Sign-up